 d3 sandwich
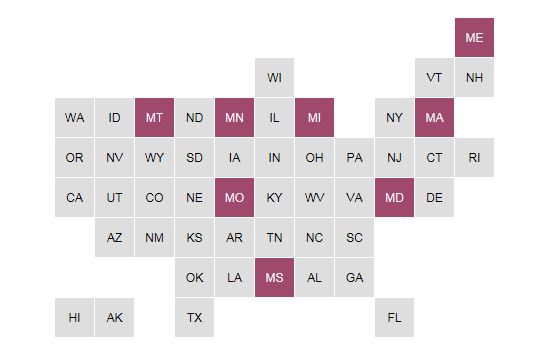
Abstract State Map
There are plenty of tools to create detailed state maps. But what if you want to create a more abstract map? Excel/Tableau can't do it, but D3 can.
Once you learn how to create an abstract state map, it's easy to create other types of abstract maps – e.g., a map for a neighborhood block party.
NOTE: this recipe is based on abstract maps by Mike Bostock and David Mimno.
Difficulty: Beginner
Prerequsites: Anatomy of a D3 Web Page
The Recipe
Prep: if this is your first D3 recipe, before you get started please read Anatomy of a D3 Web Page.
1) Create the data that describes the states and selected states
2) Create a rectangle to represent each state.
3) Create a label for each state
4) Change the color of the selected states
Now It's Your Turn
Now that you've learned how to create an abstract state map, it's time to make one! Since it's your first recipe, rather than making it from scratch, let's tweak an existing map.
Here's how to copy an existing map and make a small change. Try changing the selected states or the state colors!
Related Recipes
This recipe hasn't just taught you how to create an abstract state map. It's also giving you the tools to easily create other types of abstract maps. Just change the data that describes the map and what data you'll highlight and you've got a brand-new map.
To get your creative juices flowing, here's a recipe for another type of abstract map: a neighborhood block party.
Code Created by the Recipe
<!DOCTYPE html>
<head>
  <meta charset="utf-8">
  <script src="http://d3js.org/d3.v3.min.js"></script>                <!-- Load the d3 library -->
</head>
<body style="font-family: sans-serif;">

<h3> Abstract State Map</h3>
<svg width="960" height="400"></svg>        <!-- SVG graphics will go here  -->

<script type="text/javascript">

// States that will be given a different color
var selected_states = [ {"state": "OR"},  {"state": "MA"} ];

var  state_map = [
    { "state": "ME", "row": 0, "col": 10 },
    { "state": "WI", "row": 1, "col": 5 },
    { "state": "VT", "row": 1, "col": 9 },
    { "state": "NH", "row": 1, "col": 10 },
    { "state": "WA", "row": 2, "col": 0 },
    { "state": "ID", "row": 2, "col": 1 },
    { "state": "MT", "row": 2, "col": 2 },
    { "state": "ND", "row": 2, "col": 3 },
    { "state": "MN", "row": 2, "col": 4 },
    { "state": "IL", "row": 2, "col": 5 },
    { "state": "MI", "row": 2, "col": 6 },
    { "state": "NY", "row": 2, "col": 8 },
    { "state": "MA", "row": 2, "col": 9 },
    { "state": "OR", "row": 3, "col": 0 },
    { "state": "NV", "row": 3, "col": 1 },
    { "state": "WY", "row": 3, "col": 2 },
    { "state": "SD", "row": 3, "col": 3 },
    { "state": "IA", "row": 3, "col": 4 },
    { "state": "IN", "row": 3, "col": 5 },
    { "state": "OH", "row": 3, "col": 6 },
    { "state": "PA", "row": 3, "col": 7 },
    { "state": "NJ", "row": 3, "col": 8 },
    { "state": "CT", "row": 3, "col": 9 },
    { "state": "RI", "row": 3, "col": 10 },
    { "state": "CA", "row": 4, "col": 0 },
    { "state": "UT", "row": 4, "col": 1 },
    { "state": "CO", "row": 4, "col": 2 },
    { "state": "NE", "row": 4, "col": 3 },
    { "state": "MO", "row": 4, "col": 4 },
    { "state": "KY", "row": 4, "col": 5 },
    { "state": "WV", "row": 4, "col": 6 },
    { "state": "VA", "row": 4, "col": 7 },
    { "state": "MD", "row": 4, "col": 8 },
    { "state": "DE", "row": 4, "col": 9 },
    { "state": "AZ", "row": 5, "col": 1 },
    { "state": "NM", "row": 5, "col": 2 },
    { "state": "KS", "row": 5, "col": 3 },
    { "state": "AR", "row": 5, "col": 4 },
    { "state": "TN", "row": 5, "col": 5 },
    { "state": "NC", "row": 5, "col": 6 },
    { "state": "SC", "row": 5, "col": 7 },
    { "state": "OK", "row": 6, "col": 3 },
    { "state": "LA", "row": 6, "col": 4 },
    { "state": "MS", "row": 6, "col": 5 },
    { "state": "AL", "row": 6, "col": 6 },
    { "state": "GA", "row": 6, "col": 7 },
    { "state": "HI", "row": 7, "col": 0 },
    { "state": "AK", "row": 7, "col": 1 },
    { "state": "TX", "row": 7, "col": 3 },
    { "state": "FL", "row": 7, "col": 8 }
];

var width = 40, height = 40, cellsize = 39;

svg_area = d3.select("svg")

// Insert a rectangle for each state
svg_area.selectAll("rect")
    .data(state_map)
  .enter()
  .append("rect")
    .attr("x", function(d,i)  { return d.col * width + 100;})
    .attr("y", function(d,i) {return d.row * height;})
    .attr("width", cellsize)
    .attr("height", cellsize)
    .style("fill", "Sienna");


// Put the name of each state on its rectangle
svg_area.selectAll("text")
  .data(state_map)
  .enter()
  .append("text")
    .attr("x", function(d,i)  { return d.col * width + 108;})
    .attr("y", function(d,i) {return d.row * height +  26;})
    .text(function (d) { return d.state; })
    .style("font",   "16px sans-serif")
    .style("fill", "White")
    .style("pointer-events", "none");    // If you put the mouse over one of the states, this prevents it from treating it like text (reword)


// Return a list of the rectangles for each selected state
var state_rects =  svg_area
    .selectAll("rect")
    .data( selected_states, function(d) { return d.state; });

// Change the background color of each of those states to orange
 state_rects.style("fill", "orange");    // For every state that was joined, change the color to orange

</script>

</body>
</html>