Creating a Sense of Play
Here's an example of how you can make working with data more playful.
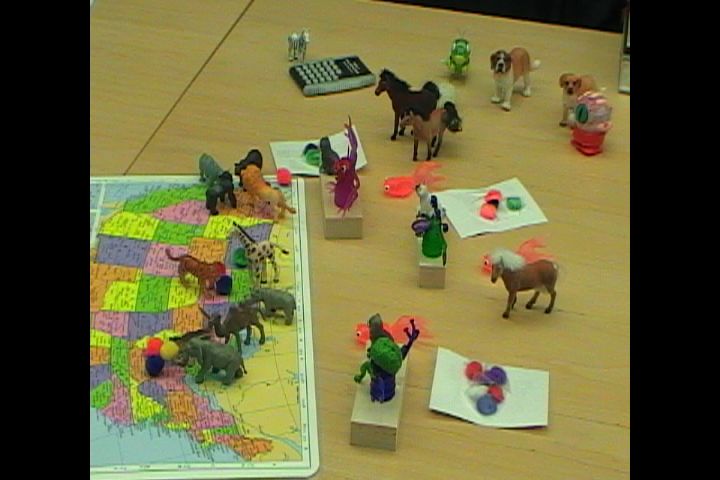
These pictures are part of a session Anders ran for grassroots state political directors on understanding changes to how the data folks collected while knocking on doors would be cleaned up. Back when political canvassing was done using paper and pen, if you signed up someone to be a member of your organization but the canvaser messes up the contact data, for all practical purposes you haven't signed up that member because you can't communicate with them. So reducing the number of errors -- which at the time was over 10% of all new members -- was critical. For political directors, it was also really, really boring. And the session was on a Friday, at the end of a very intense confernce, just after lunch.
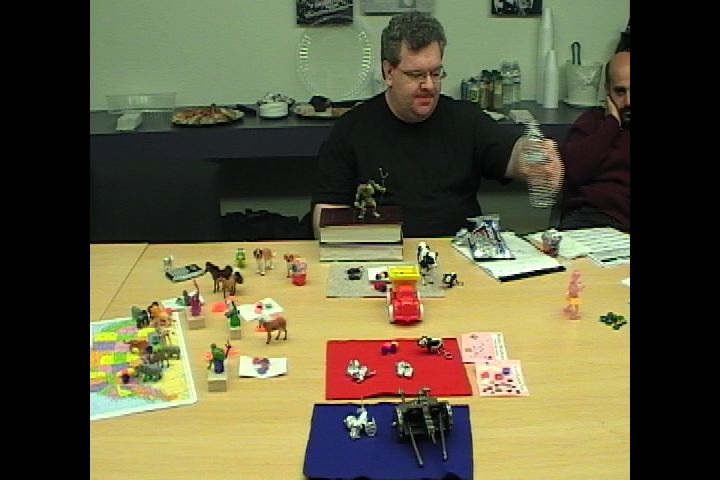
So, Anders used maps, toys, blocks and other bits and pieces to tell the story of how the data was collected now and how the proposed new approach would work. These pictures capture part of that story.
It was a smashing success. The political directors really got it, and they provided really great feedback on how to make the new approach work better in the field. The new approach was implemented without a hitch, and the error rate was cut in half.